


Production - Australia
Search Data and Analysis
View Production By
Top Produced Commodities: MY 2025/2026
| Commodity | Unit | % of Global Production | 10-Year Average 2016-2025 | 2024/2025 Production | 2025/2026 Production | % Change |
|---|---|---|---|---|---|---|
| Barley | Metric Tons | 11% | 12.55 Million | 13.27 Million | 16.63 Million | 25% |
| Almonds | Metric Tons | 10% | 124,490 | 155,000 | 170,000 | 10% |
| Rapeseed | Metric Tons | 8% | 5.3 Million | 6.4 Million | 7.68 Million | 20% |
| Oats | Metric Tons | 6% | 1.5 Million | 1.32 Million | 1.7 Million | 29% |
| Beef | Metric Tons | 5% | 2.26 Million | 2.58 Million | 2.89 Million | 12% |
| Wheat | Metric Tons | 4% | 28.96 Million | 34.11 Million | 35.99 Million | 5% |
| Sorghum | Metric Tons | 4% | 1.81 Million | 2.69 Million | 2.5 Million | -7% |
| Live Cattle | Head | 4% | 9.46 Million | 8.89 Million | 10.5 Million | 18% |
| Cotton | 480 lb. Bales | 4% | 4.12 Million | 5.6 Million | 4.5 Million | -20% |
| Nonfat Dry Milk | Metric Tons | 3% | 175,000 | 172,000 | 170,000 | -1% |
Australia Annual Crop Yield 2016 - 2025
10-Year Average
MY 2016-2025
MY 2016-2025
2.68634 (MT/HA)
10-Year Compound
Average Growth
Average Growth
2% MY 2016-2025
2024/2025
Yield
Yield
2.8706 (MT/HA)
2025/2026
Yield
Yield
3.4841 (MT/HA)
10-Year Trend
+44.4%
Production Maps
Image:

Image:

Image:

Image:
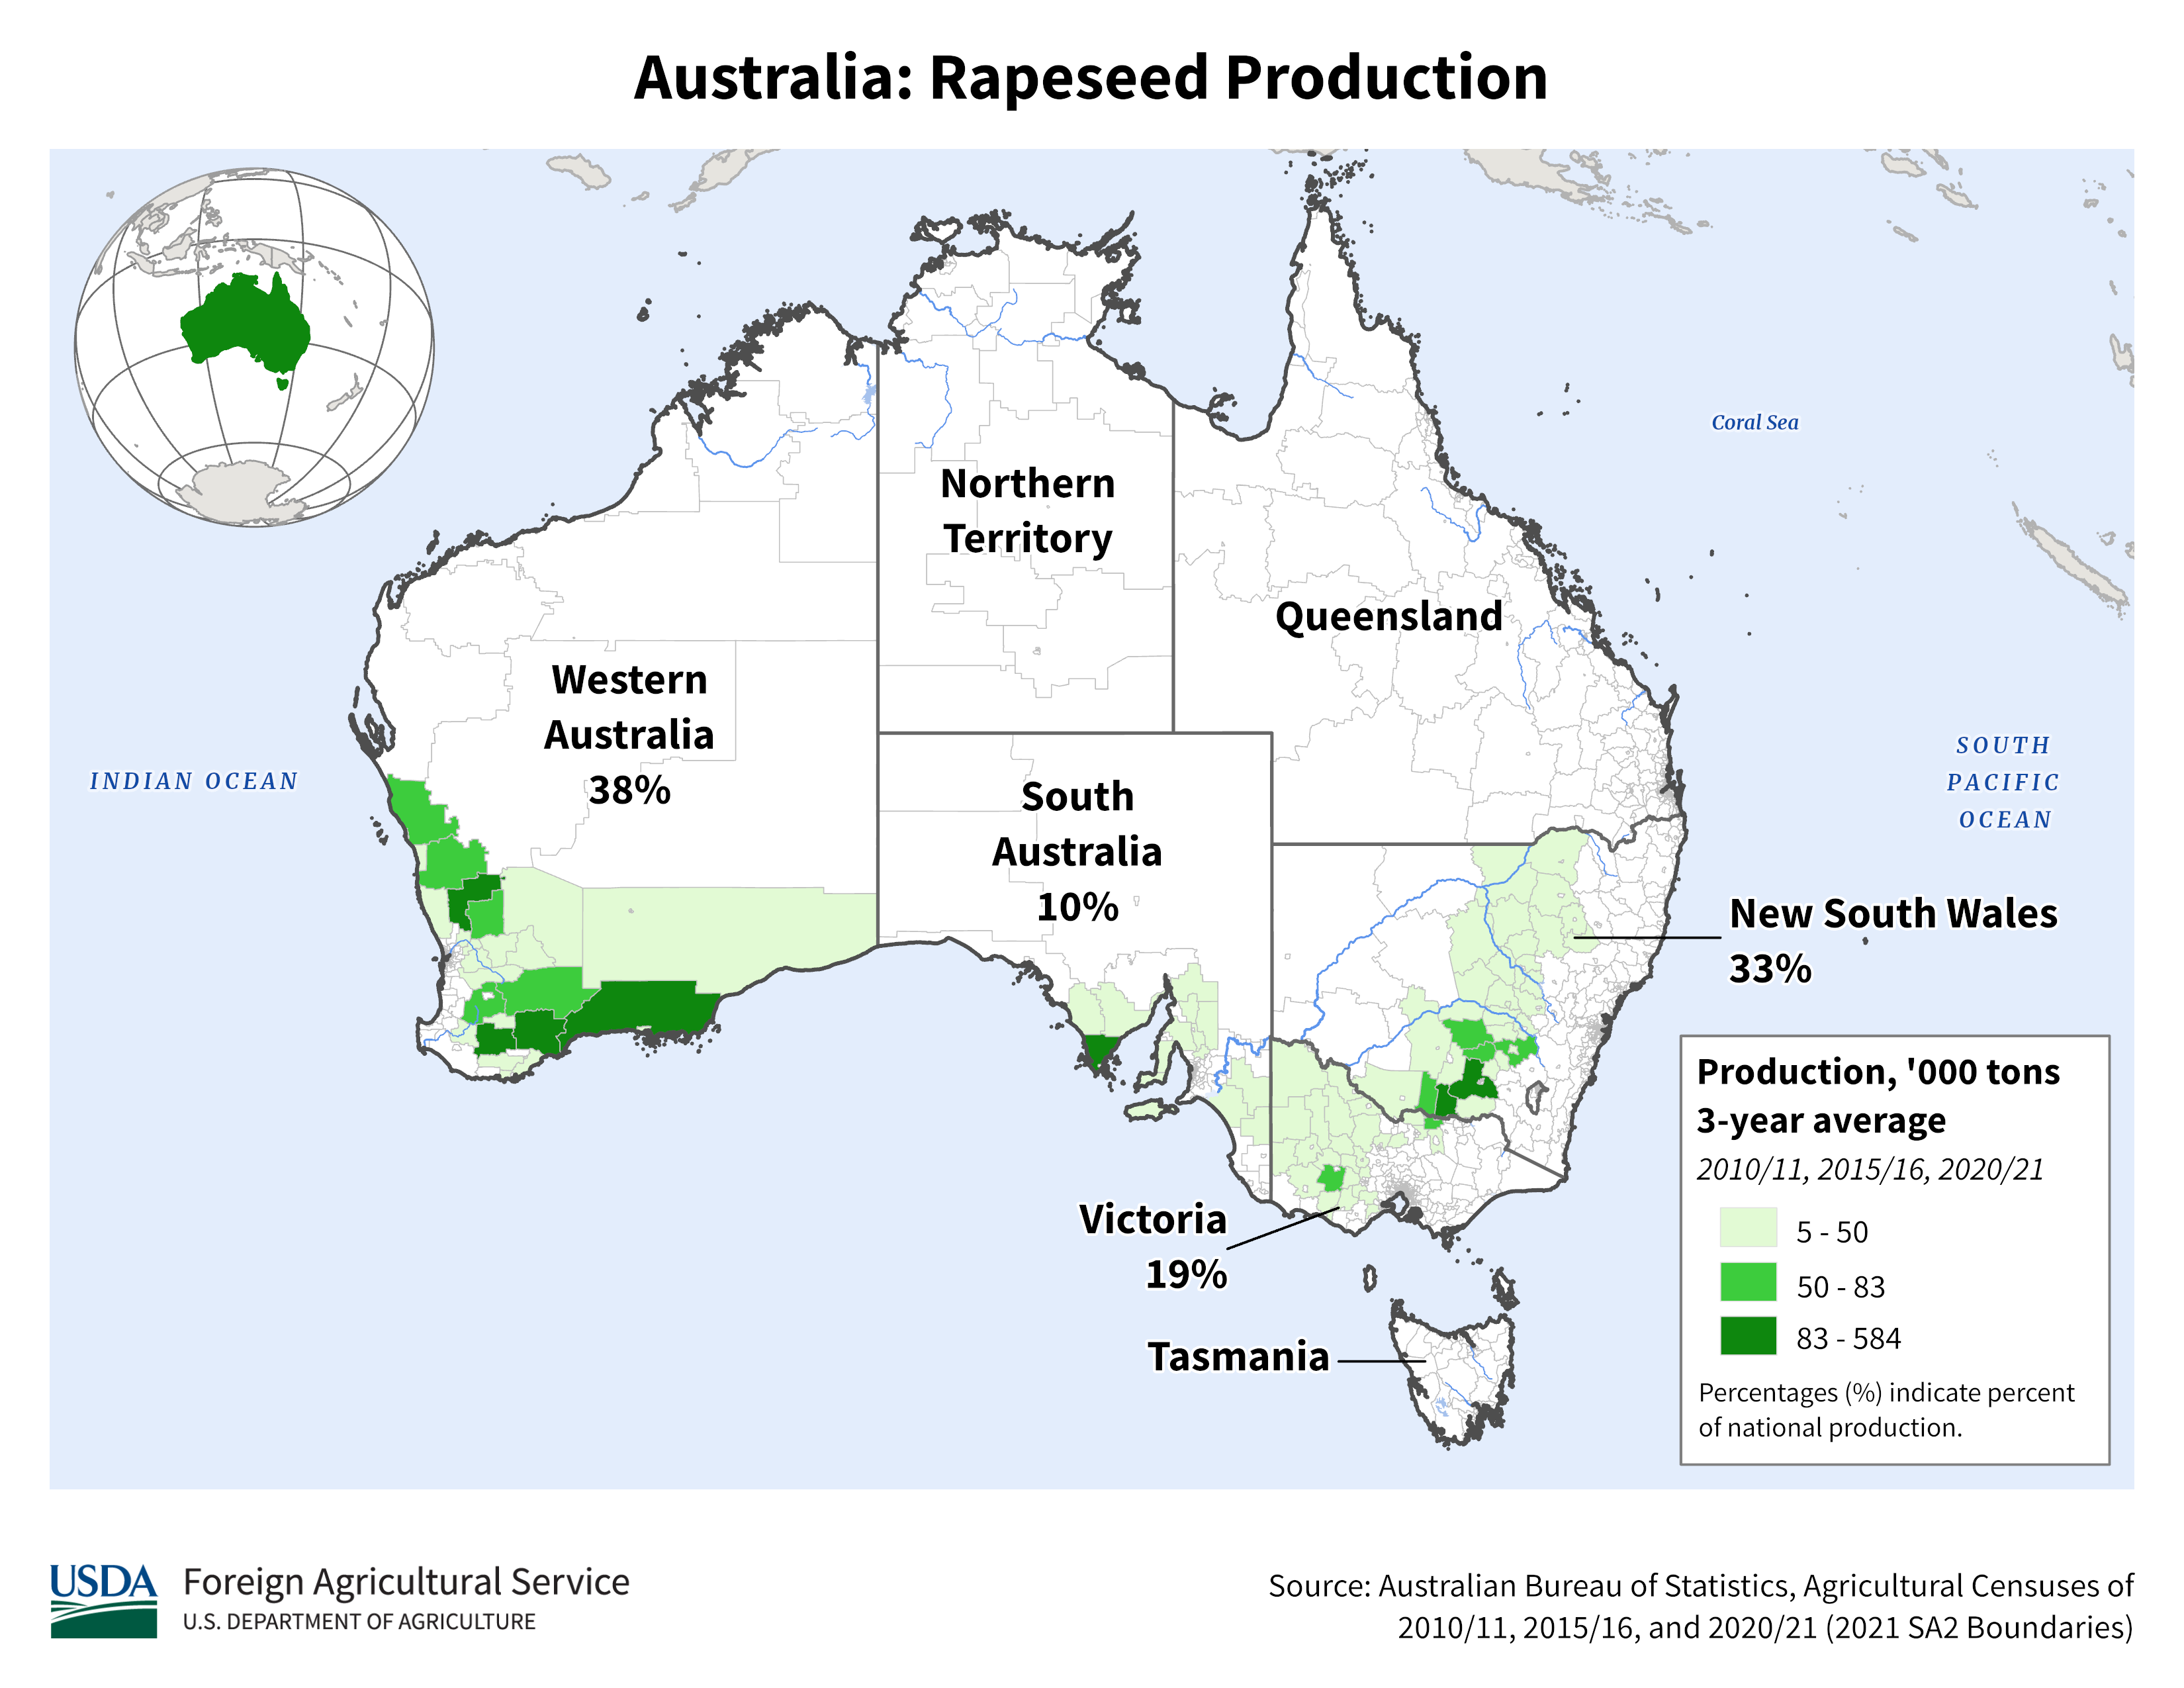
Image:

Image:

Image:

Image:

Image:

Crop Calendars
Image:

Image:

