


Production - Colombia
Search Data and Analysis
View Production By
Top Produced Commodities: MY 2025/2026
| Commodity | Unit | % of Global Production | 10-Year Average 2016-2025 | 2024/2025 Production | 2025/2026 Production | % Change |
|---|---|---|---|---|---|---|
| Coffee | 60 KG Bags | 7% | 13.24 Million | 14.8 Million | 12.5 Million | -16% |
| Palm Oil | Metric Tons | 2% | 1.74 Million | 1.9 Million | 2 Million | 5% |
| Chicken Meat | Metric Tons | 2% | 1.78 Million | 1.9 Million | 2.07 Million | 9% |
| Meal, Palm Kernel | Metric Tons | 2% | 176,400 | 183,000 | 186,000 | 2% |
| Oilseed, Palm Kernel | Metric Tons | 2% | 317,200 | 330,000 | 335,000 | 2% |
| Oil, Palm Kernel | Metric Tons | 1% | 128,100 | 133,000 | 135,000 | 2% |
| Beef | Metric Tons | 1% | 766,400 | 766,000 | 824,000 | 8% |
| Sugar | Metric Tons | 1% | 2.28 Million | 2.25 Million | 2.3 Million | 2% |
| Pork | Metric Tons | 0.52% | 468,500 | 588,000 | 628,000 | 7% |
| Rice | Metric Tons | 0.35% | 1.84 Million | 2.05 Million | 1.89 Million | -8% |
Colombia Annual Crop Yield 2016 - 2025
10-Year Average
MY 2016-2025
MY 2016-2025
2.32333 (MT/HA)
10-Year Compound
Average Growth
Average Growth
-2% MY 2016-2025
2024/2025
Yield
Yield
2.3333 (MT/HA)
2025/2026
Yield
Yield
2 (MT/HA)
10-Year Trend
-5.6%
Production Maps
Image:

Image:

Image:

Image:
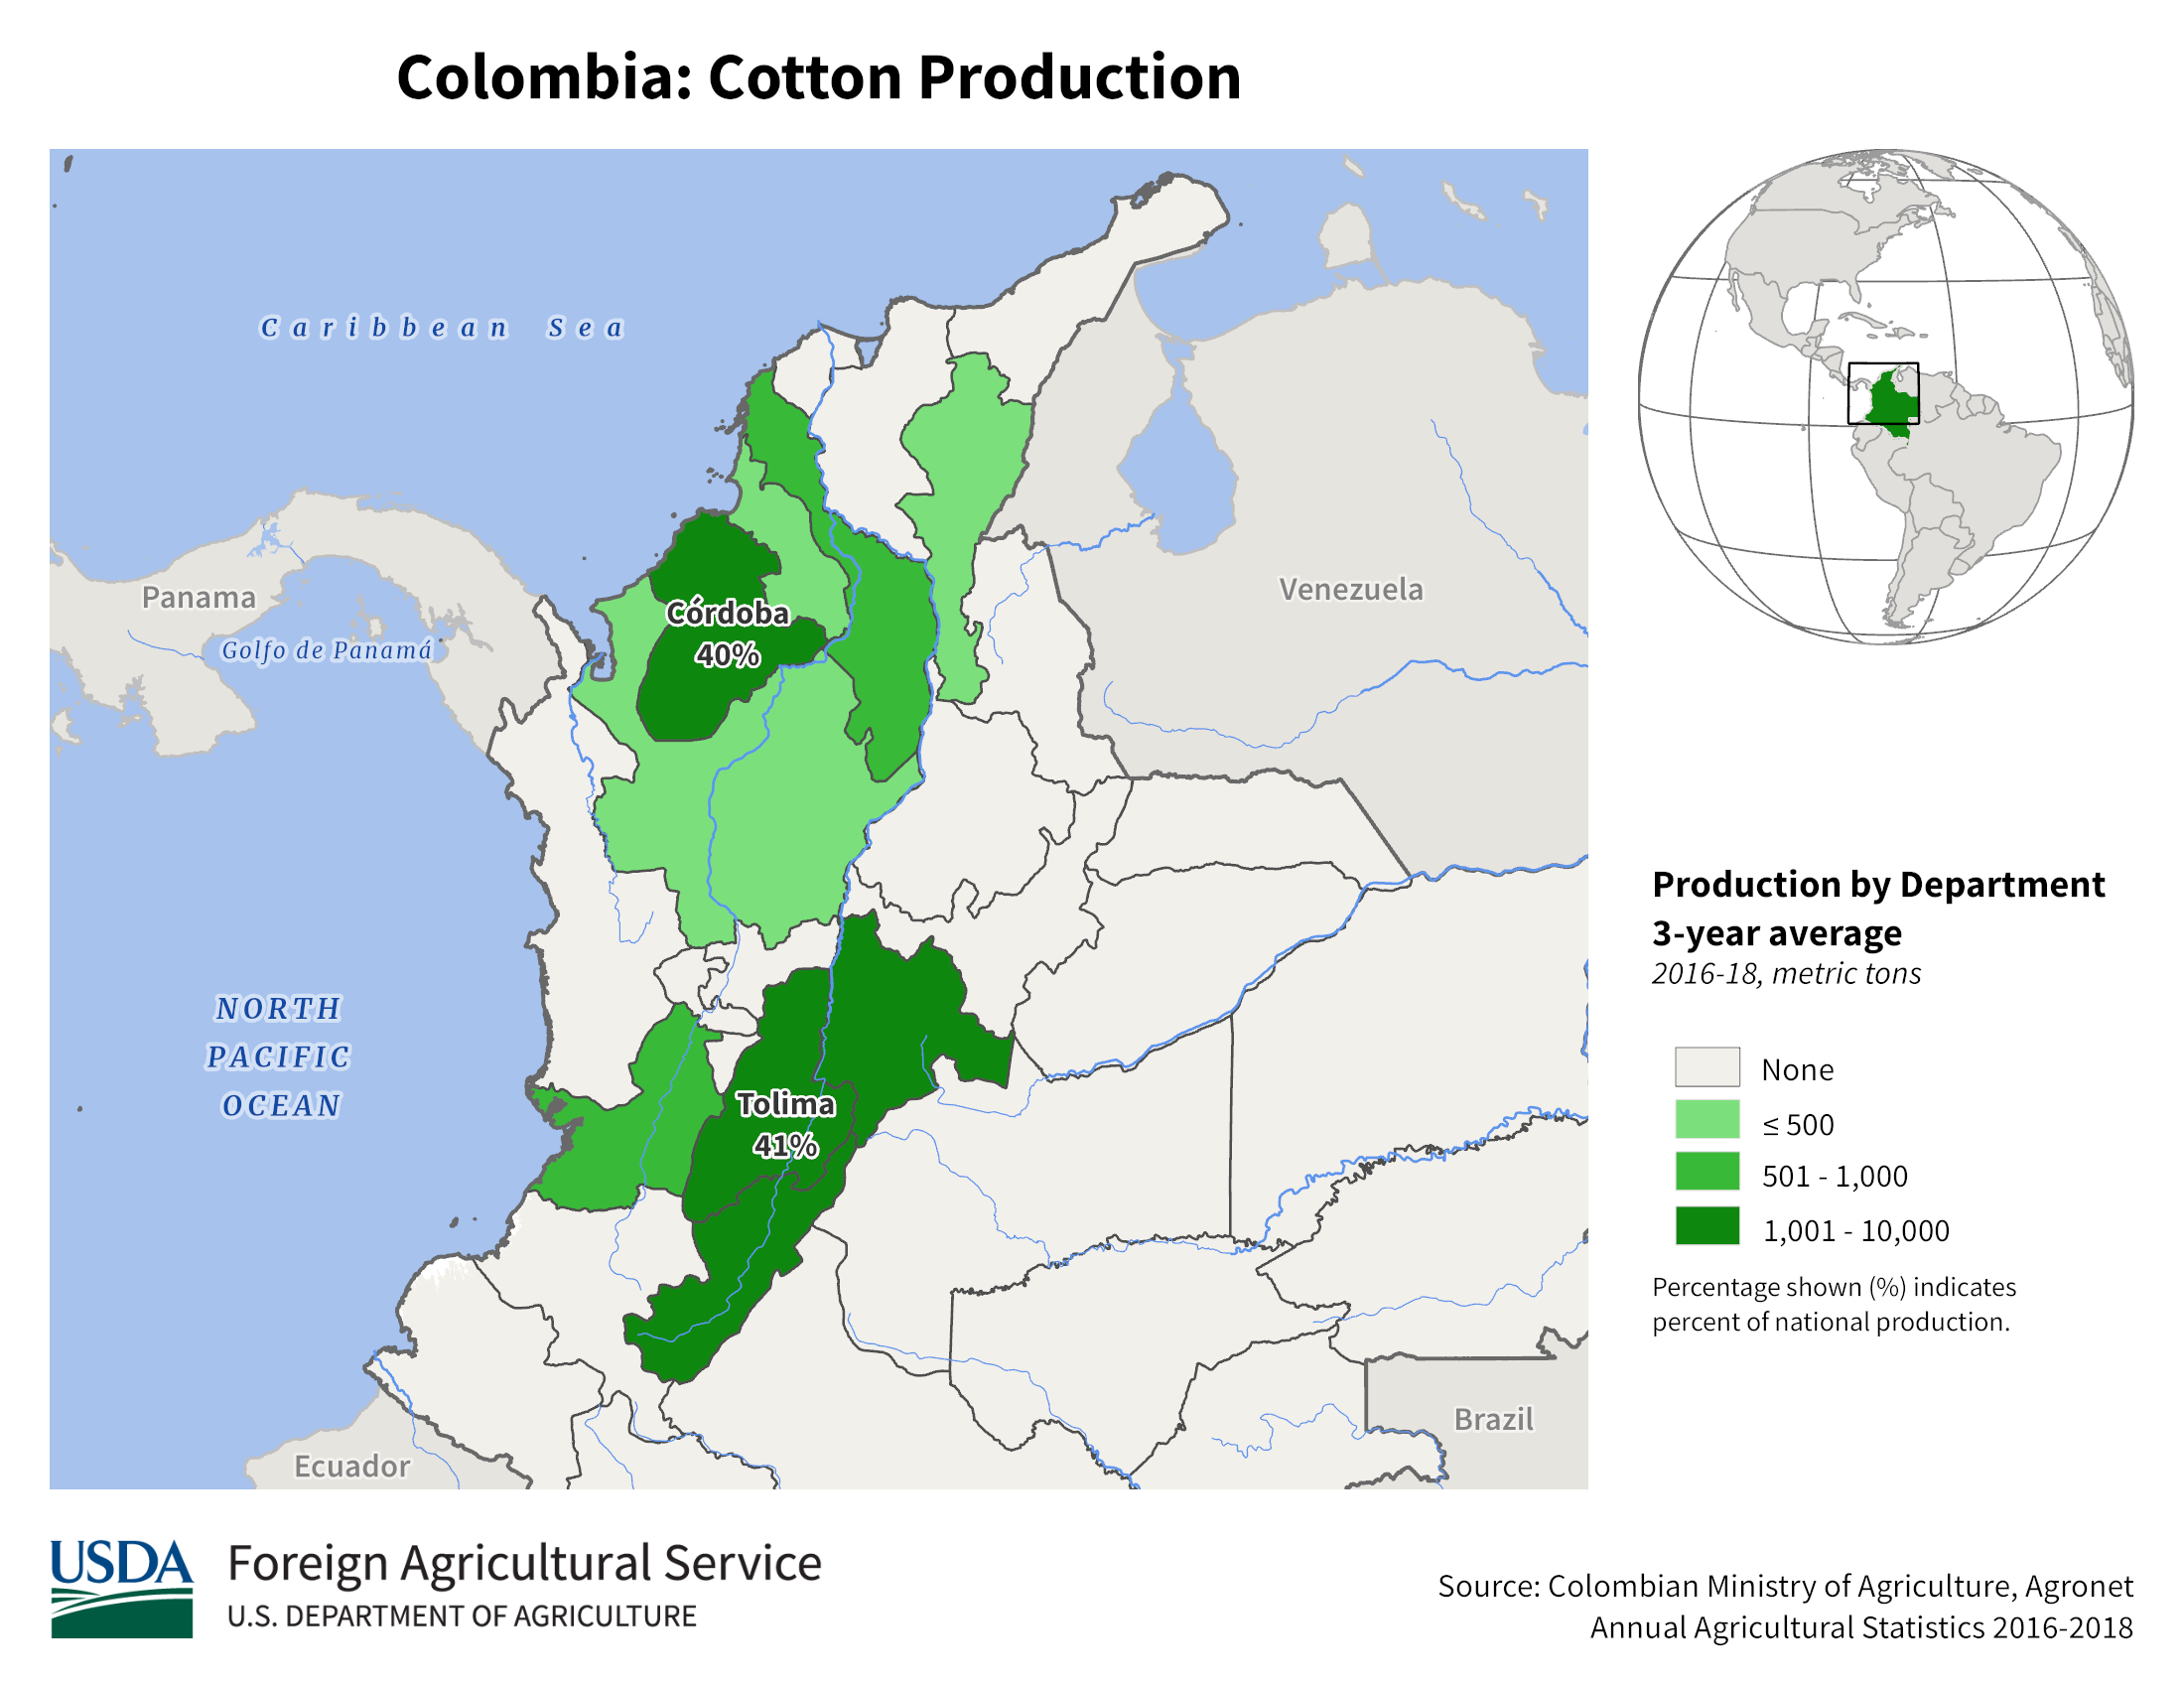
Image:

Image:

Image:

Image:

Image:

Image:

Image:

Crop Calendars
Image:

Image:

