


Production - Egypt
Search Data and Analysis
View Production By
Top Produced Commodities: MY 2025/2026
| Commodity | Unit | % of Global Production | 10-Year Average 2016-2025 | 2024/2025 Production | 2025/2026 Production | % Change |
|---|---|---|---|---|---|---|
| Oranges | Metric Tons | 9% | 3.48 Million | 3.5 Million | 4 Million | 14% |
| Table Grapes | Metric Tons | 6% | 1.44 Million | 1.65 Million | 1.67 Million | 1% |
| Sugar | Metric Tons | 2% | 2.71 Million | 3.1 Million | 3.18 Million | 3% |
| Soybean Meal | Metric Tons | 1% | 2.88 Million | 3.56 Million | 3.83 Million | 8% |
| Sorghum | Metric Tons | 1% | 774,600 | 790,000 | 780,000 | -1% |
| Soybean Oil | Metric Tons | 1% | 665,400 | 824,000 | 887,000 | 8% |
| Wheat | Metric Tons | 1% | 9.02 Million | 9 Million | 9.2 Million | 2% |
| Rice | Metric Tons | 0.77% | 3.86 Million | 3.9 Million | 4.2 Million | 8% |
| Beef | Metric Tons | 0.71% | 385,700 | 440,000 | 440,000 | 0% |
| Corn | Metric Tons | 0.5% | 6.78 Million | 7 Million | 6.7 Million | -4% |
Egypt Annual Area Harvested 2016 - 2025
| Commodity | Total Area Harvested (2025/2026, Hectares) |
|---|---|
| Wheat | 1.3 Million |
| Corn | 850,000 |
| Rice | 720,000 |
| Other Oilseeds | 164,000 |
| Oranges | 160,000 |
| Sorghum | 150,000 |
| Cotton | 100,000 |
| Table Grapes | 75,000 |
| Soybeans | 30,000 |
| Barley | 22,000 |
Egypt Annual Crop Yield 2016 - 2025
10-Year Average
MY 2016-2025
MY 2016-2025
3.96654 (MT/HA)
10-Year Compound
Average Growth
Average Growth
0.25% MY 2016-2025
2024/2025
Yield
Yield
4.0909 (MT/HA)
2025/2026
Yield
Yield
4.0909 (MT/HA)
10-Year Trend
+6.8%
Production Maps
Image:

Image:

Image:

Image:

Image:

Image:

Image:
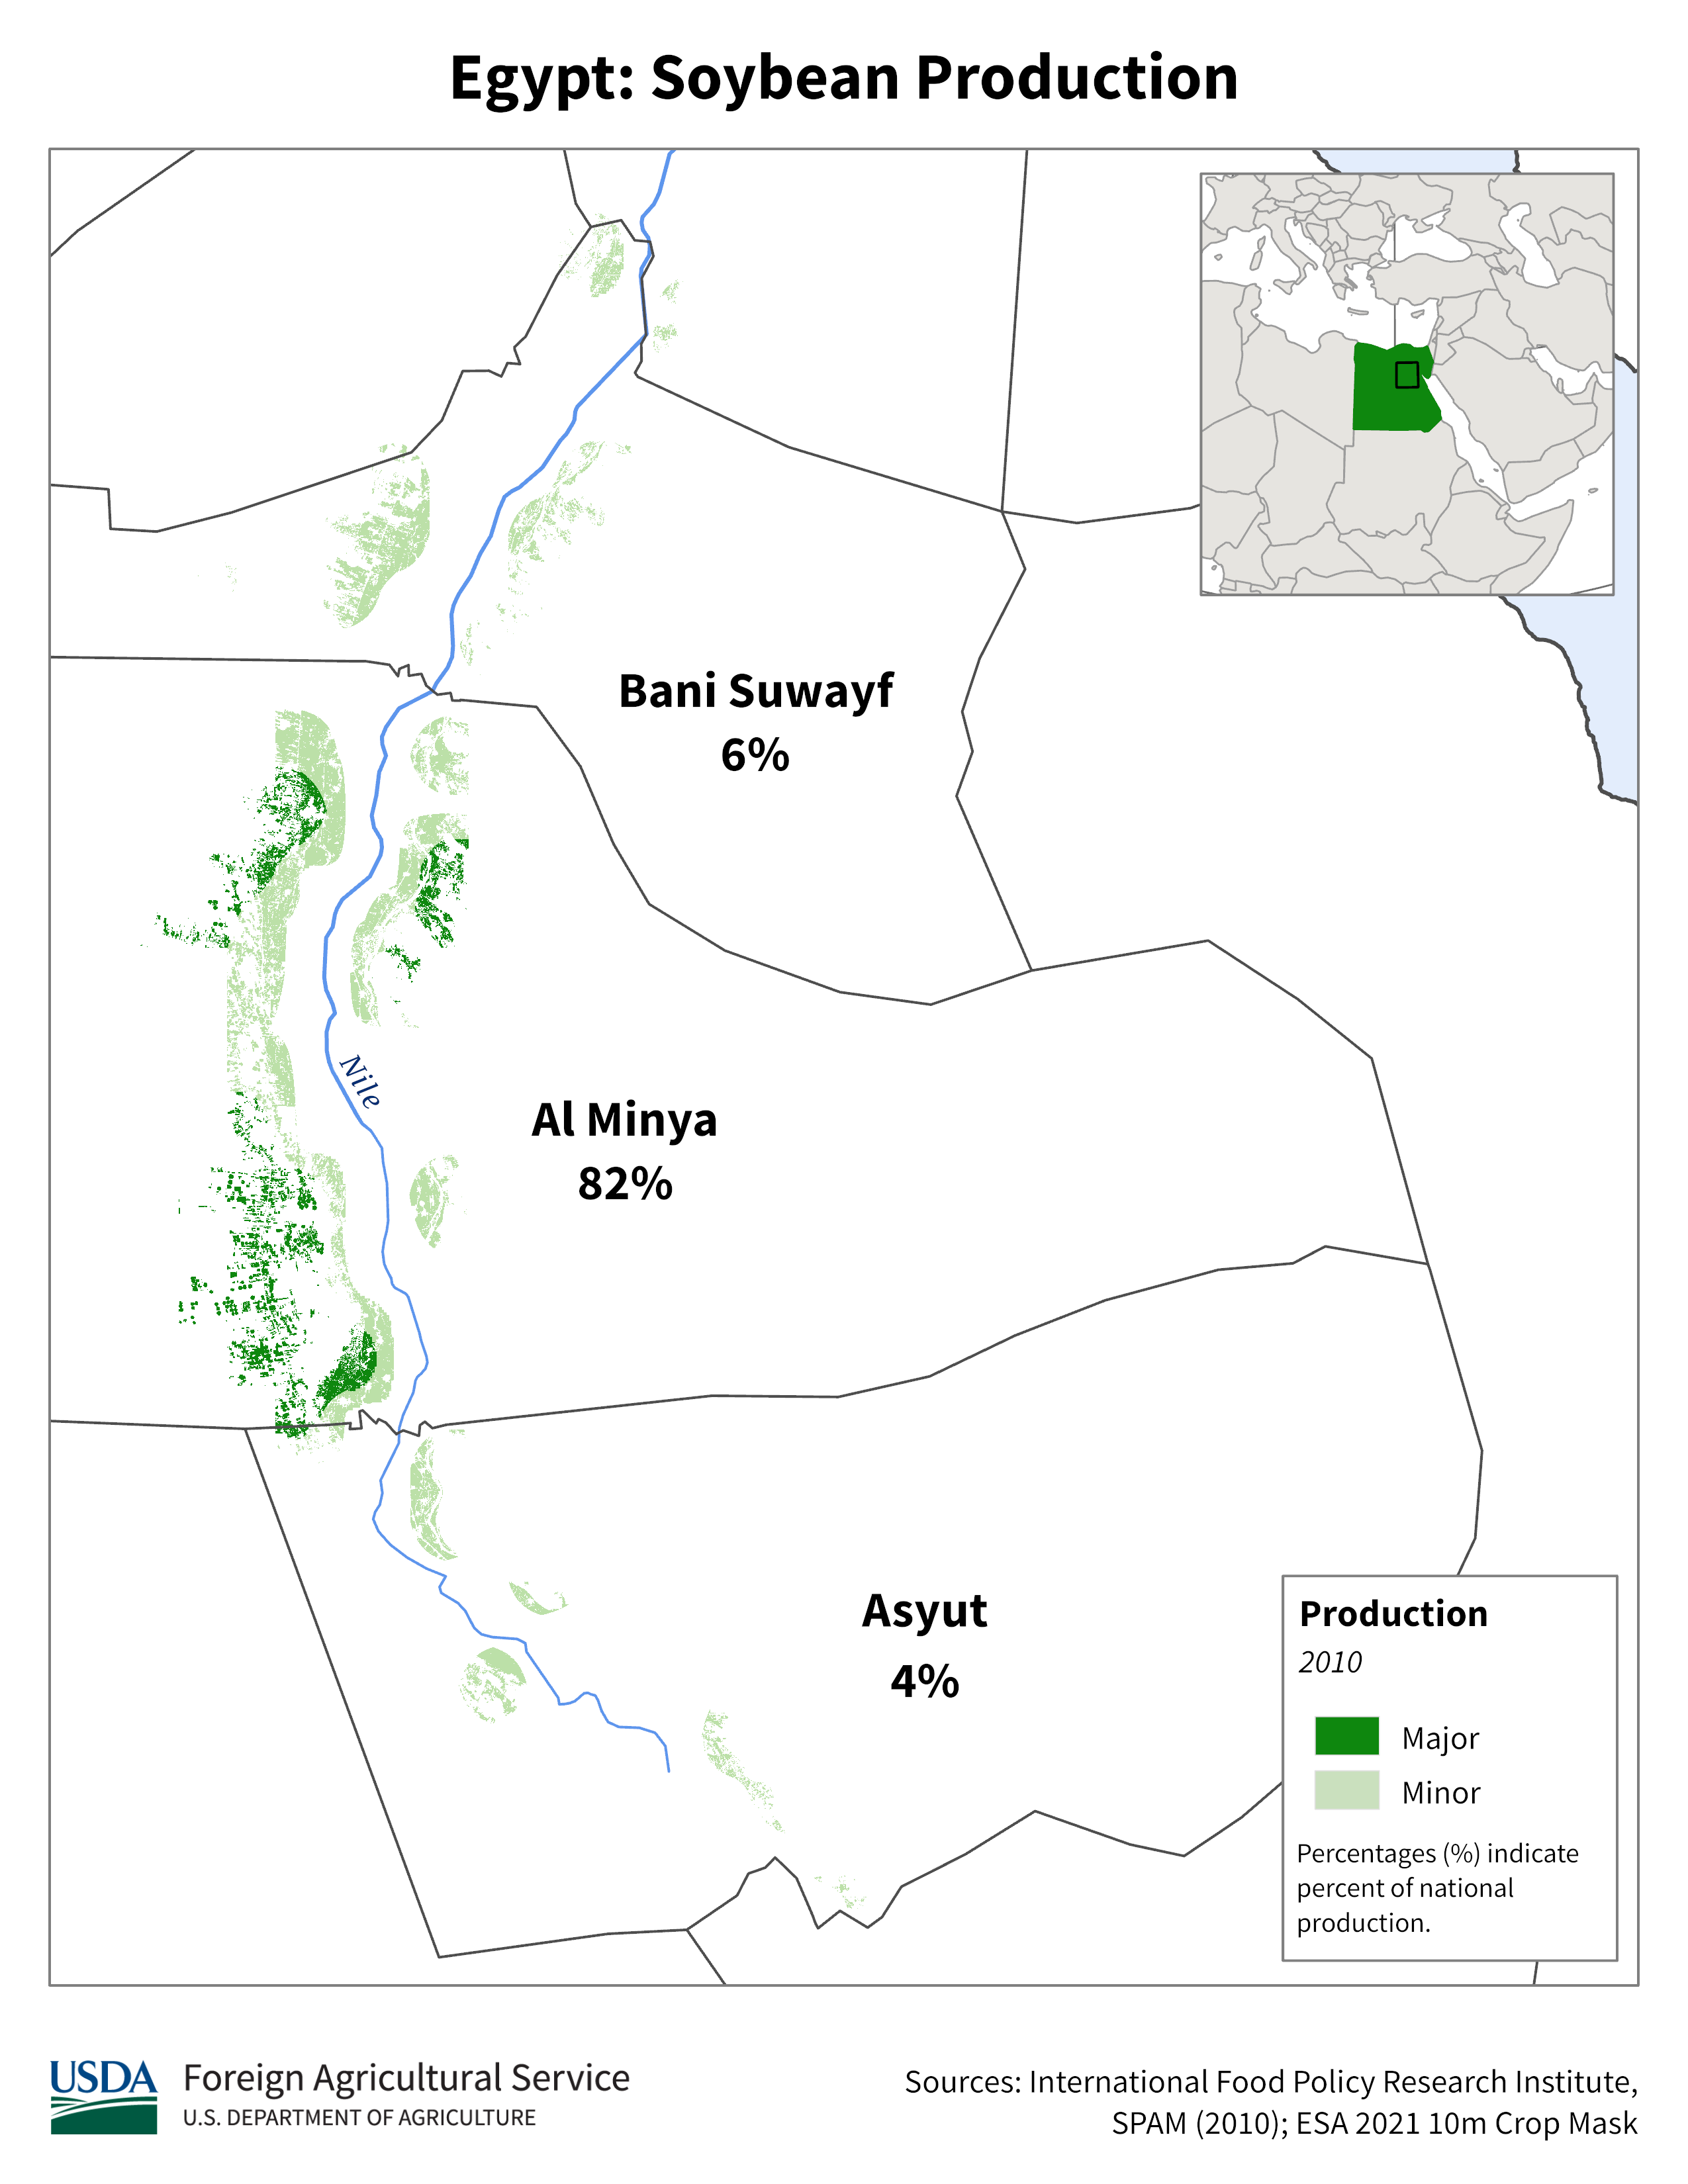
Image:

Image:

Crop Calendars
Image:

Image:

