


Production - India
Search Data and Analysis
View Production By
Top Produced Commodities: MY 2025/2026
| Commodity | Unit | % of Global Production | 10-Year Average 2016-2025 | 2024/2025 Production | 2025/2026 Production | % Change |
|---|---|---|---|---|---|---|
| Butter | Metric Tons | 58% | 6.19 Million | 6.98 Million | 7.19 Million | 3% |
| Millet | Metric Tons | 44% | 12.42 Million | 13.64 Million | 13.23 Million | -3% |
| Fluid Milk | Metric Tons | 32% | 195.15 Million | 211.7 Million | 216.5 Million | 2% |
| Meal, Cottonseed | Metric Tons | 29% | 4.26 Million | 4.26 Million | 4.21 Million | -1% |
| Rice | Metric Tons | 28% | 128.94 Million | 150.18 Million | 154.02 Million | 3% |
| Oil, Cottonseed | Metric Tons | 27% | 1.31 Million | 1.31 Million | 1.3 Million | -1% |
| Live Cattle | Head | 25% | 69.44 Million | 70.58 Million | 71.1 Million | 0.74% |
| Oilseed, Cottonseed | Metric Tons | 24% | 11.11 Million | 10.19 Million | 10.1 Million | -0.83% |
| Meal, Peanut | Metric Tons | 22% | 1.55 Million | 1.59 Million | 1.68 Million | 5% |
| Oil, Peanut | Metric Tons | 21% | 1.22 Million | 1.26 Million | 1.32 Million | 5% |
India Annual Crop Yield 2016 - 2025
10-Year Average
MY 2016-2025
MY 2016-2025
2.86591 (MT/HA)
10-Year Compound
Average Growth
Average Growth
3% MY 2016-2025
2024/2025
Yield
Yield
3.0835 (MT/HA)
2025/2026
Yield
Yield
3.1563 (MT/HA)
10-Year Trend
+24.8%
Production Maps
Image:

Image:

Image:

Image:

Image:

Image:

Image:

Image:

Image:

Image:

Image:

Image:

Image:

Image:

Image:
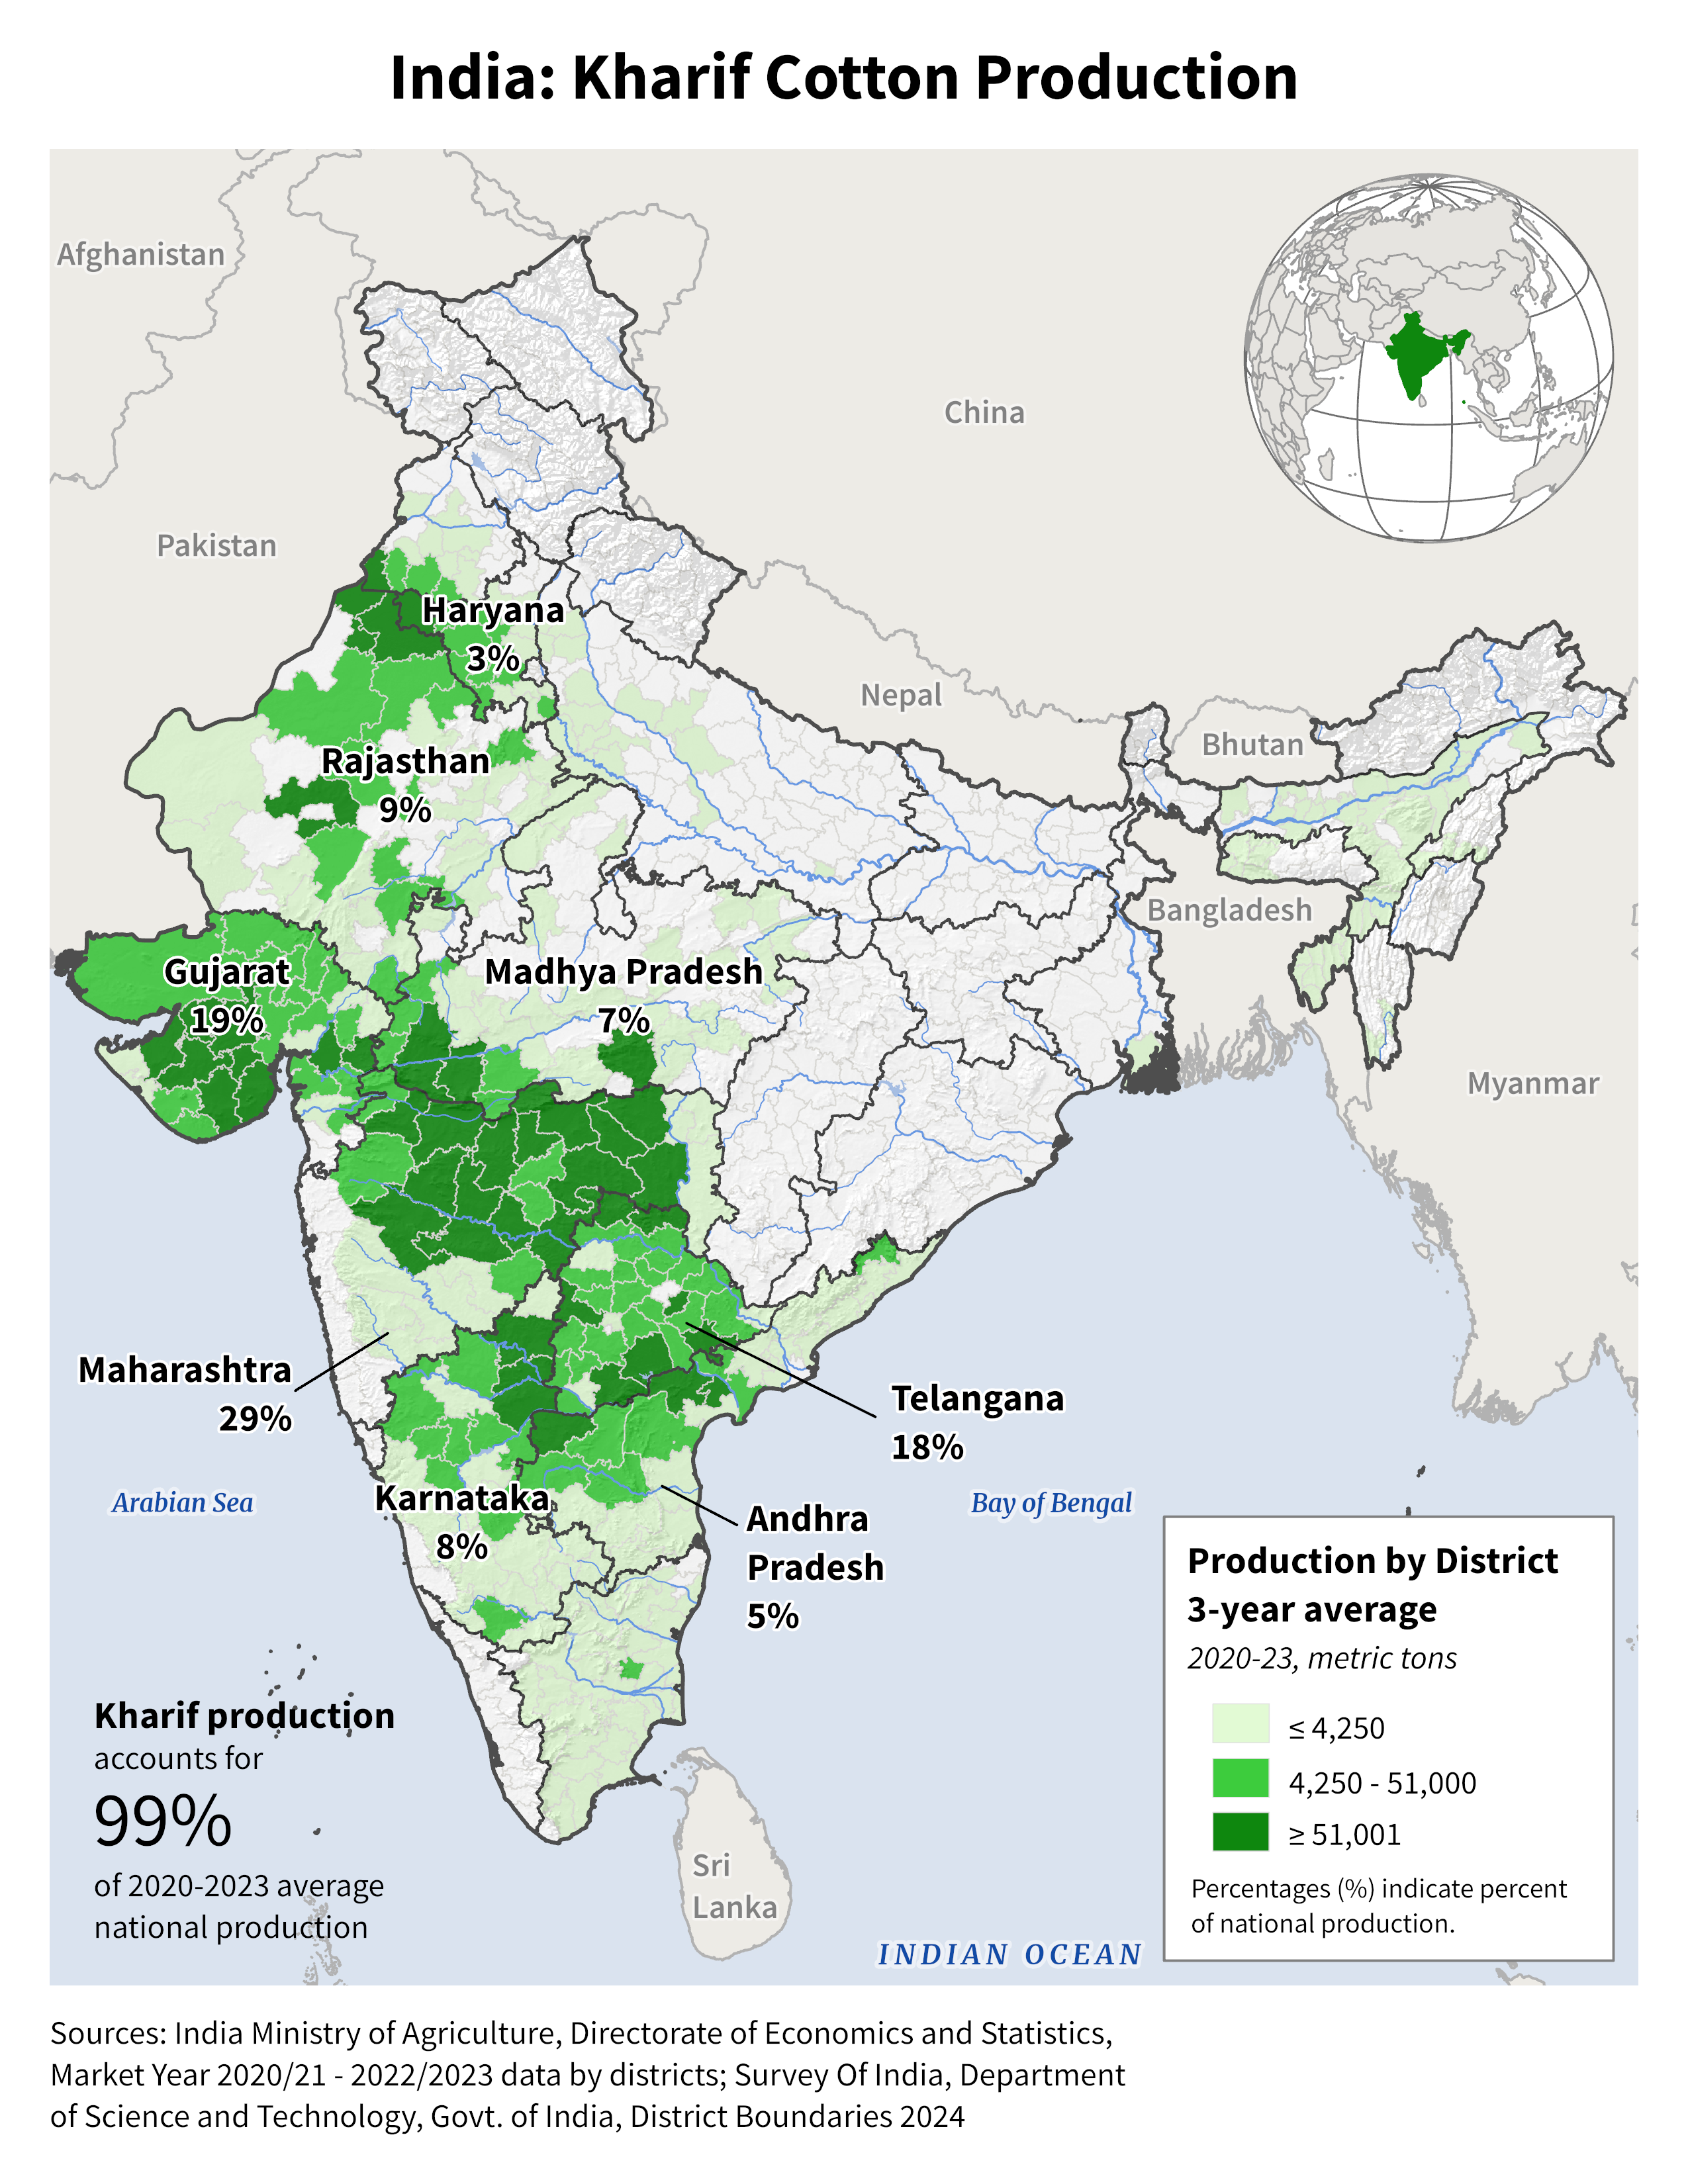
Image:

Image:

Image:

Image:

Image:

Image:

Image:

Image:

Image:

Image:

Image:

Crop Calendars
Image:

Image:

