


Production - Iran
Search Data and Analysis
View Production By
Top Produced Commodities: MY 2025/2026
| Commodity | Unit | % of Global Production | 10-Year Average 2016-2025 | 2024/2025 Production | 2025/2026 Production | % Change |
|---|---|---|---|---|---|---|
| Pistachios | Metric Tons | 18% | 166,100 | 225,000 | 200,000 | -11% |
| Cherries | Metric Tons | 6% | 253,181 | 270,000 | 270,000 | 0% |
| Peaches & Nectarines | Metric Tons | 3% | 577,600 | 638,100 | 638,100 | 0% |
| Apples | Metric Tons | 3% | 2.21 Million | 2.18 Million | 2.18 Million | 0% |
| Barley | Metric Tons | 2% | 3.16 Million | 3.1 Million | 3 Million | -3% |
| Wheat | Metric Tons | 2% | 14.1 Million | 16 Million | 13.5 Million | -16% |
| Sugar | Metric Tons | 0.97% | 1.64 Million | 1.8 Million | 1.8 Million | 0% |
| Soybean Meal | Metric Tons | 0.67% | 1.96 Million | 2.25 Million | 1.98 Million | -12% |
| Soybean Oil | Metric Tons | 0.62% | 453,700 | 522,000 | 458,000 | -12% |
| Oil, Cottonseed | Metric Tons | 0.51% | 19,400 | 23,000 | 24,000 | 4% |
Iran Annual Area Harvested 2016 - 2025
| Commodity | Total Area Harvested (2025/2026, Hectares) |
|---|---|
| Wheat | 6.2 Million |
| Barley | 1.7 Million |
| Rice | 570,000 |
| Corn | 200,000 |
| Rapeseed | 155,000 |
| Other Oilseeds | 100,000 |
| Cotton | 100,000 |
| Soybeans | 70,000 |
| Sunflowerseed | 42,000 |
| Sorghum | 10,000 |
Iran Annual Crop Yield 2016 - 2025
10-Year Average
MY 2016-2025
MY 2016-2025
1.92078 (MT/HA)
10-Year Compound
Average Growth
Average Growth
-2% MY 2016-2025
2024/2025
Yield
Yield
1.9375 (MT/HA)
2025/2026
Yield
Yield
1.8182 (MT/HA)
10-Year Trend
-11.2%
Production Maps
Image:

Image:
Image:
Image:

Image:

Image:

Image:

Image:

Image:

Image:
Image:
Crop Calendars
Image:
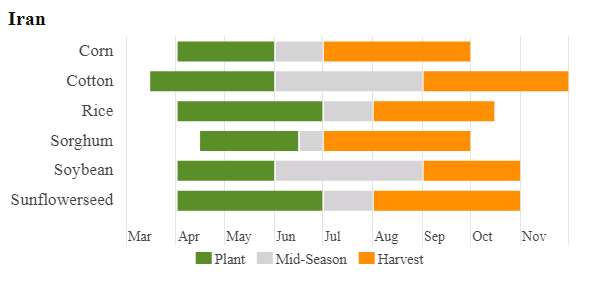
Image:

