


Production - Sudan
Search Data and Analysis
View Production By
Top Produced Commodities: MY 2025/2026
| Commodity | Unit | % of Global Production | 10-Year Average 2016-2025 | 2024/2025 Production | 2025/2026 Production | % Change |
|---|---|---|---|---|---|---|
| Sorghum | Metric Tons | 5% | 4.26 Million | 3.3 Million | 3 Million | -9% |
| Millet | Metric Tons | 2% | 1.31 Million | 793,000 | 750,000 | -5% |
| Oil, Peanut | Metric Tons | 2% | 226,300 | 186,000 | 127,000 | -32% |
| Meal, Peanut | Metric Tons | 2% | 277,800 | 234,000 | 156,000 | -33% |
| Oilseed, Peanut | Metric Tons | 2% | 2.1 Million | 1.68 Million | 1,000,000 | -41% |
| Oilseed, Cottonseed | Metric Tons | 0.18% | 181,700 | 76,000 | 76,000 | 0% |
| Meal, Cottonseed | Metric Tons | 0.16% | 45,300 | 23,000 | 23,000 | 0% |
| Oil, Cottonseed | Metric Tons | 0.15% | 15,000 | 7,000 | 7,000 | 0% |
| Sugar | Metric Tons | 0.15% | 426,500 | 275,000 | 275,000 | 0% |
| Cotton | 480 lb. Bales | 0.12% | 356,000 | 150,000 | 150,000 | 0% |
Sudan Annual Area Harvested 2016 - 2025
| Commodity | Total Area Harvested (2025/2026, Hectares) |
|---|---|
| Sorghum | 6 Million |
| Millet | 2.5 Million |
| Other Oilseeds | 2.1 Million |
| Wheat | 150,000 |
| Cotton | 70,000 |
Sudan Annual Crop Yield 2016 - 2025
10-Year Average
MY 2016-2025
MY 2016-2025
665.2 (KG/HA)
10-Year Compound
Average Growth
Average Growth
-6% MY 2016-2025
2024/2025
Yield
Yield
467 (KG/HA)
2025/2026
Yield
Yield
467 (KG/HA)
10-Year Trend
-38.9%
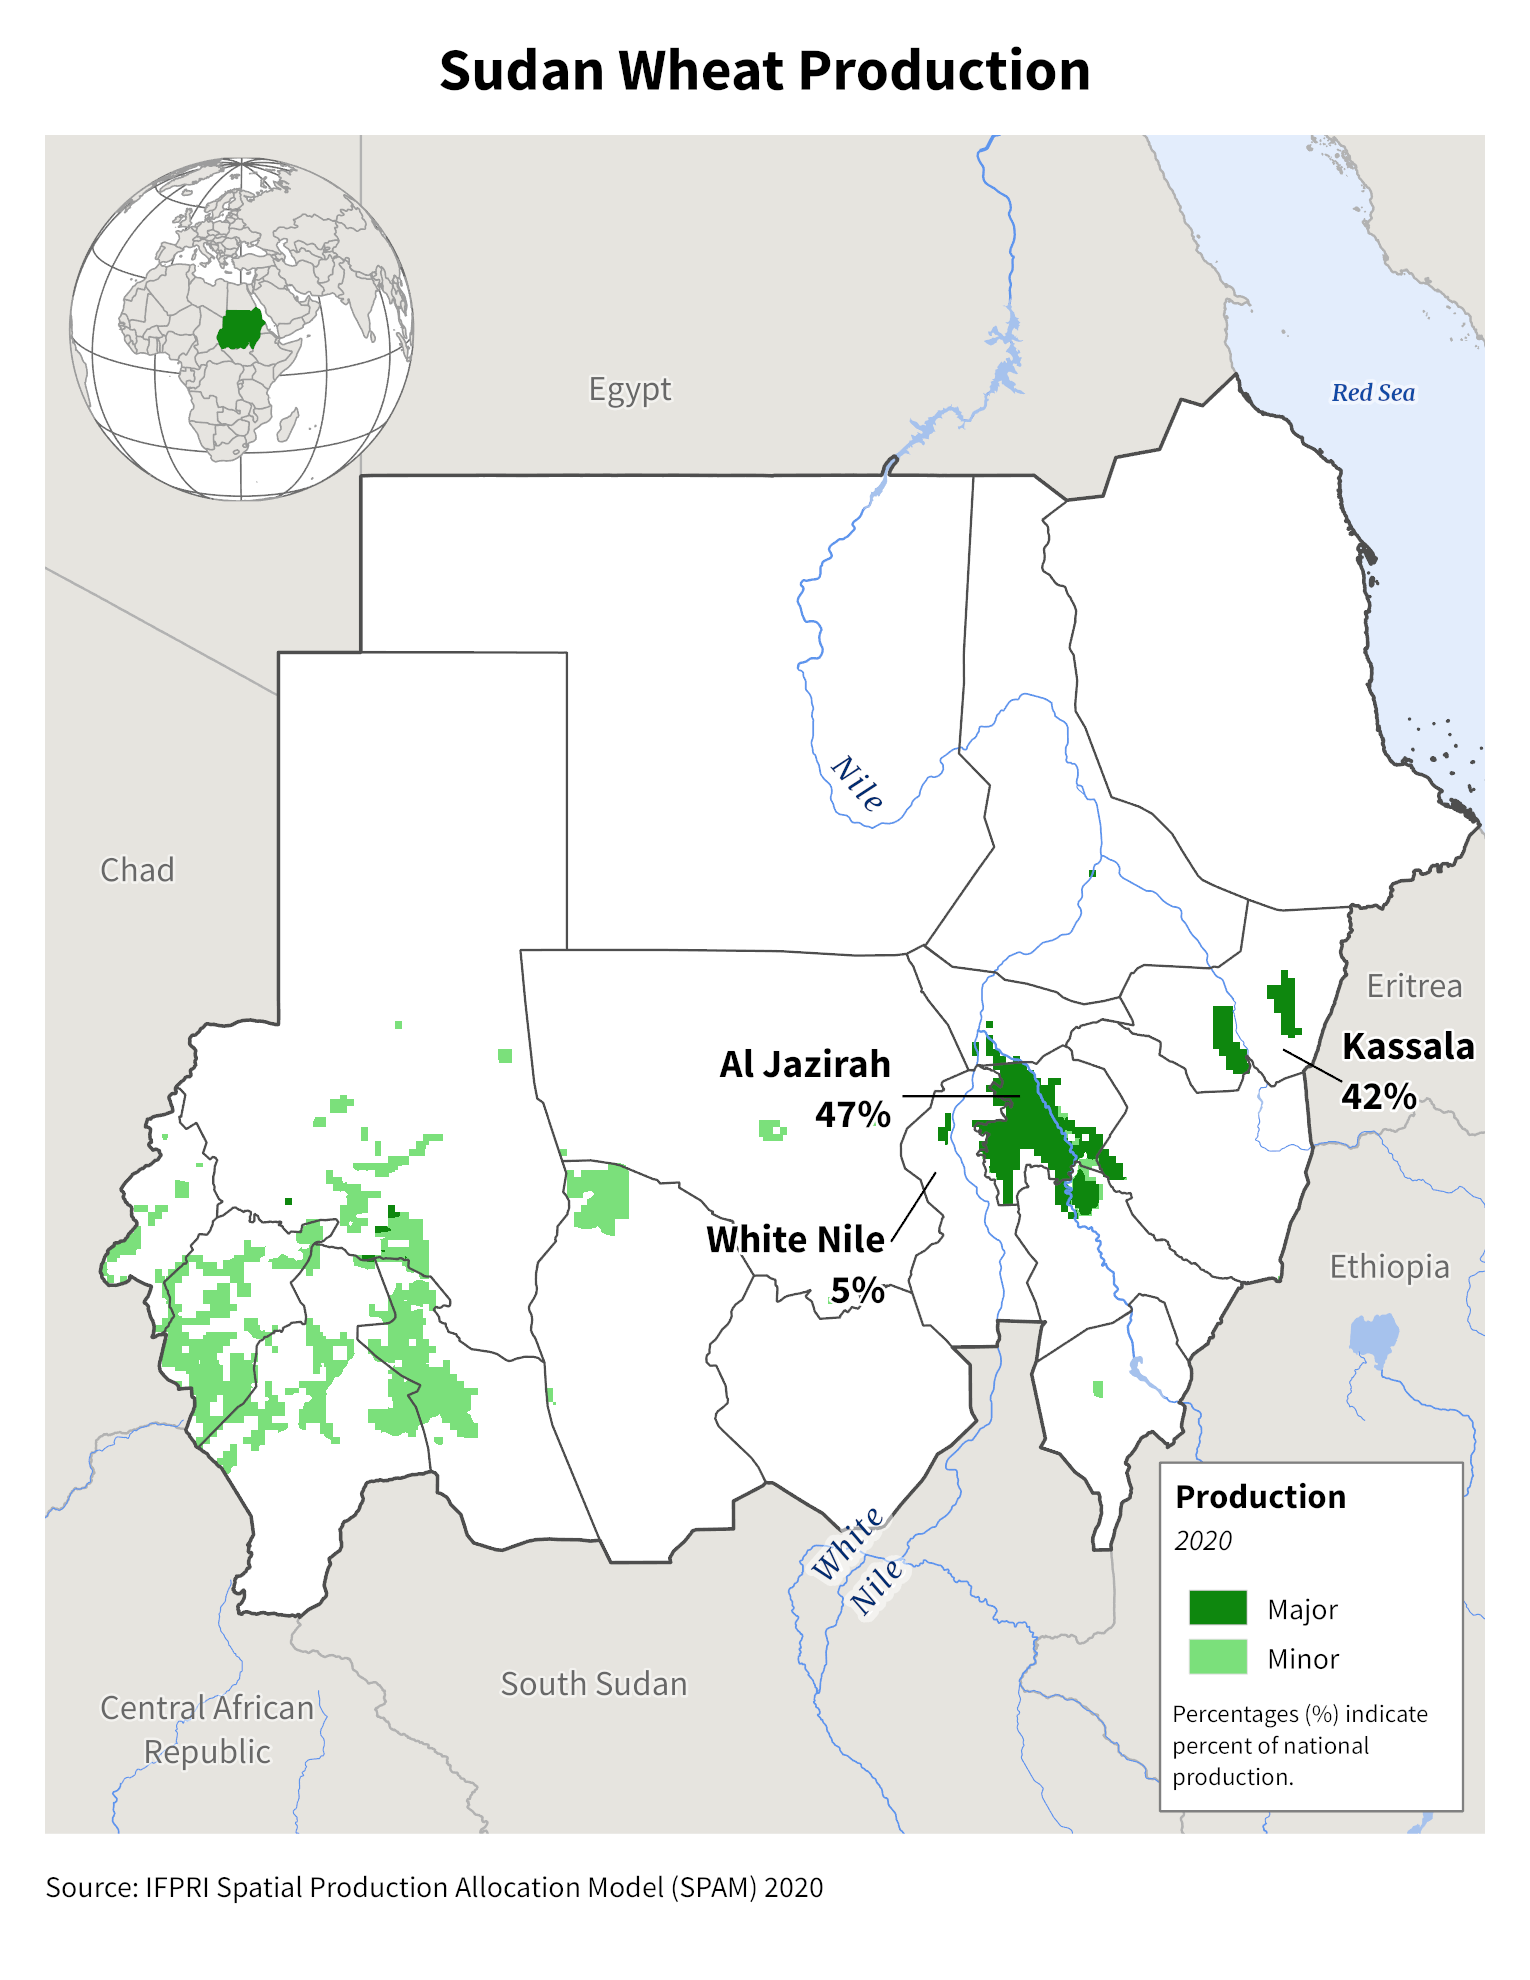
Production Maps
Image:

Image:

Image:

Image:

Image:
Crop Calendars
Image:

