


Production - Turkey
Search Data and Analysis
View Production By
Top Produced Commodities: MY 2025/2026
| Commodity | Unit | % of Global Production | 10-Year Average 2016-2025 | 2024/2025 Production | 2025/2026 Production | % Change |
|---|---|---|---|---|---|---|
| Pistachios | Metric Tons | 11% | 174,700 | 385,000 | 120,000 | -69% |
| Lemons & Limes | Metric Tons | 11% | 1.3 Million | 1.73 Million | 1.1 Million | -36% |
| Oil, Olive | Metric Tons | 6% | 255,000 | 410,000 | 210,000 | -49% |
| Cherries | Metric Tons | 6% | 806,468 | 933,200 | 288,800 | -69% |
| Sunflowerseed Meal | Metric Tons | 6% | 1.18 Million | 995,000 | 1.33 Million | 34% |
| Tangerines/Mandarins | Metric Tons | 6% | 1.82 Million | 1.99 Million | 2.19 Million | 10% |
| Sunflowerseed Oil | Metric Tons | 5% | 938,800 | 795,000 | 1.07 Million | 34% |
| Table Grapes | Metric Tons | 5% | 1.98 Million | 1.95 Million | 1.49 Million | -23% |
| Meal, Cottonseed | Metric Tons | 4% | 654,900 | 718,000 | 564,000 | -21% |
| Oil, Cottonseed | Metric Tons | 4% | 214,100 | 235,000 | 185,000 | -21% |
Turkey Annual Area Harvested 2016 - 2025
| Commodity | Total Area Harvested (2025/2026, Hectares) |
|---|---|
| Wheat | 7.3 Million |
| Barley | 3.5 Million |
| Sunflowerseed | 750,000 |
| Corn | 610,000 |
| Other Oilseeds | 445,000 |
| Cotton | 395,000 |
| Table Grapes | 190,000 |
| Apples | 165,000 |
| Oats | 135,000 |
| Rye | 105,000 |
Turkey Annual Crop Yield 2016 - 2025
10-Year Average
MY 2016-2025
MY 2016-2025
1.8084 (MT/HA)
10-Year Compound
Average Growth
Average Growth
0.47% MY 2016-2025
2024/2025
Yield
Yield
1.8667 (MT/HA)
2025/2026
Yield
Yield
1.4571 (MT/HA)
10-Year Trend
+0.6%
Production Maps
Image:

Image:
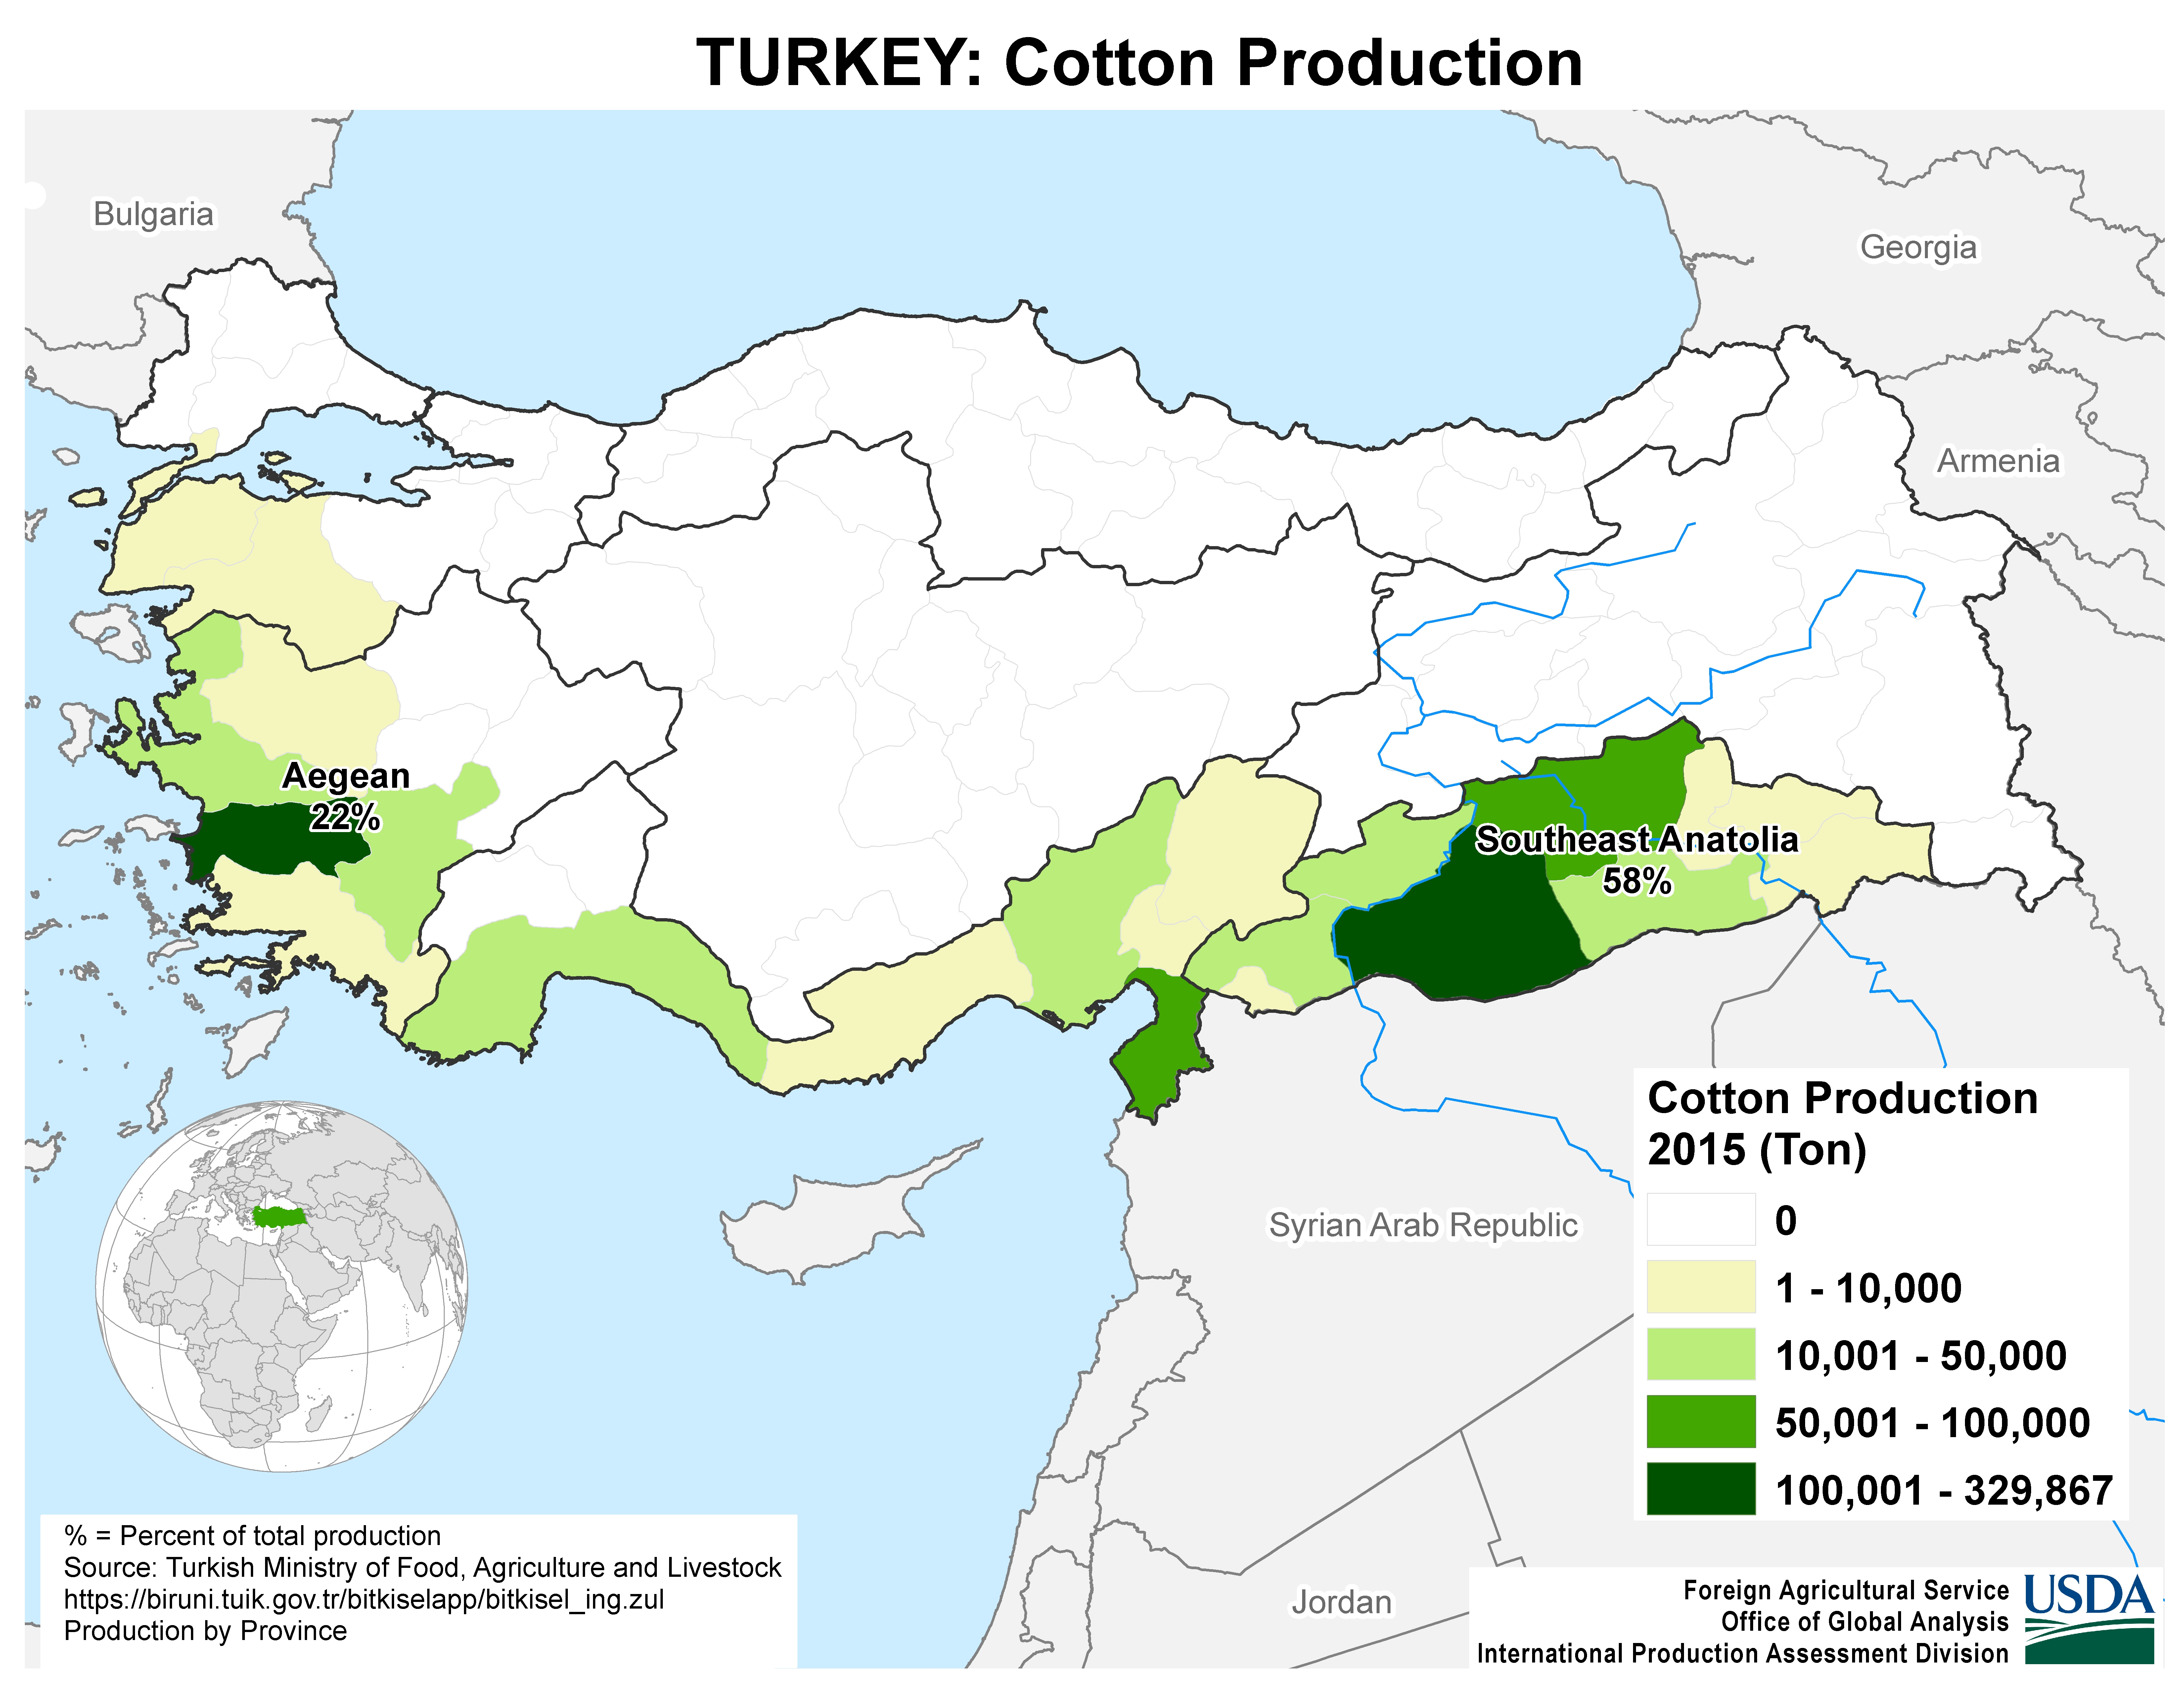
Image:

Image:

Image:
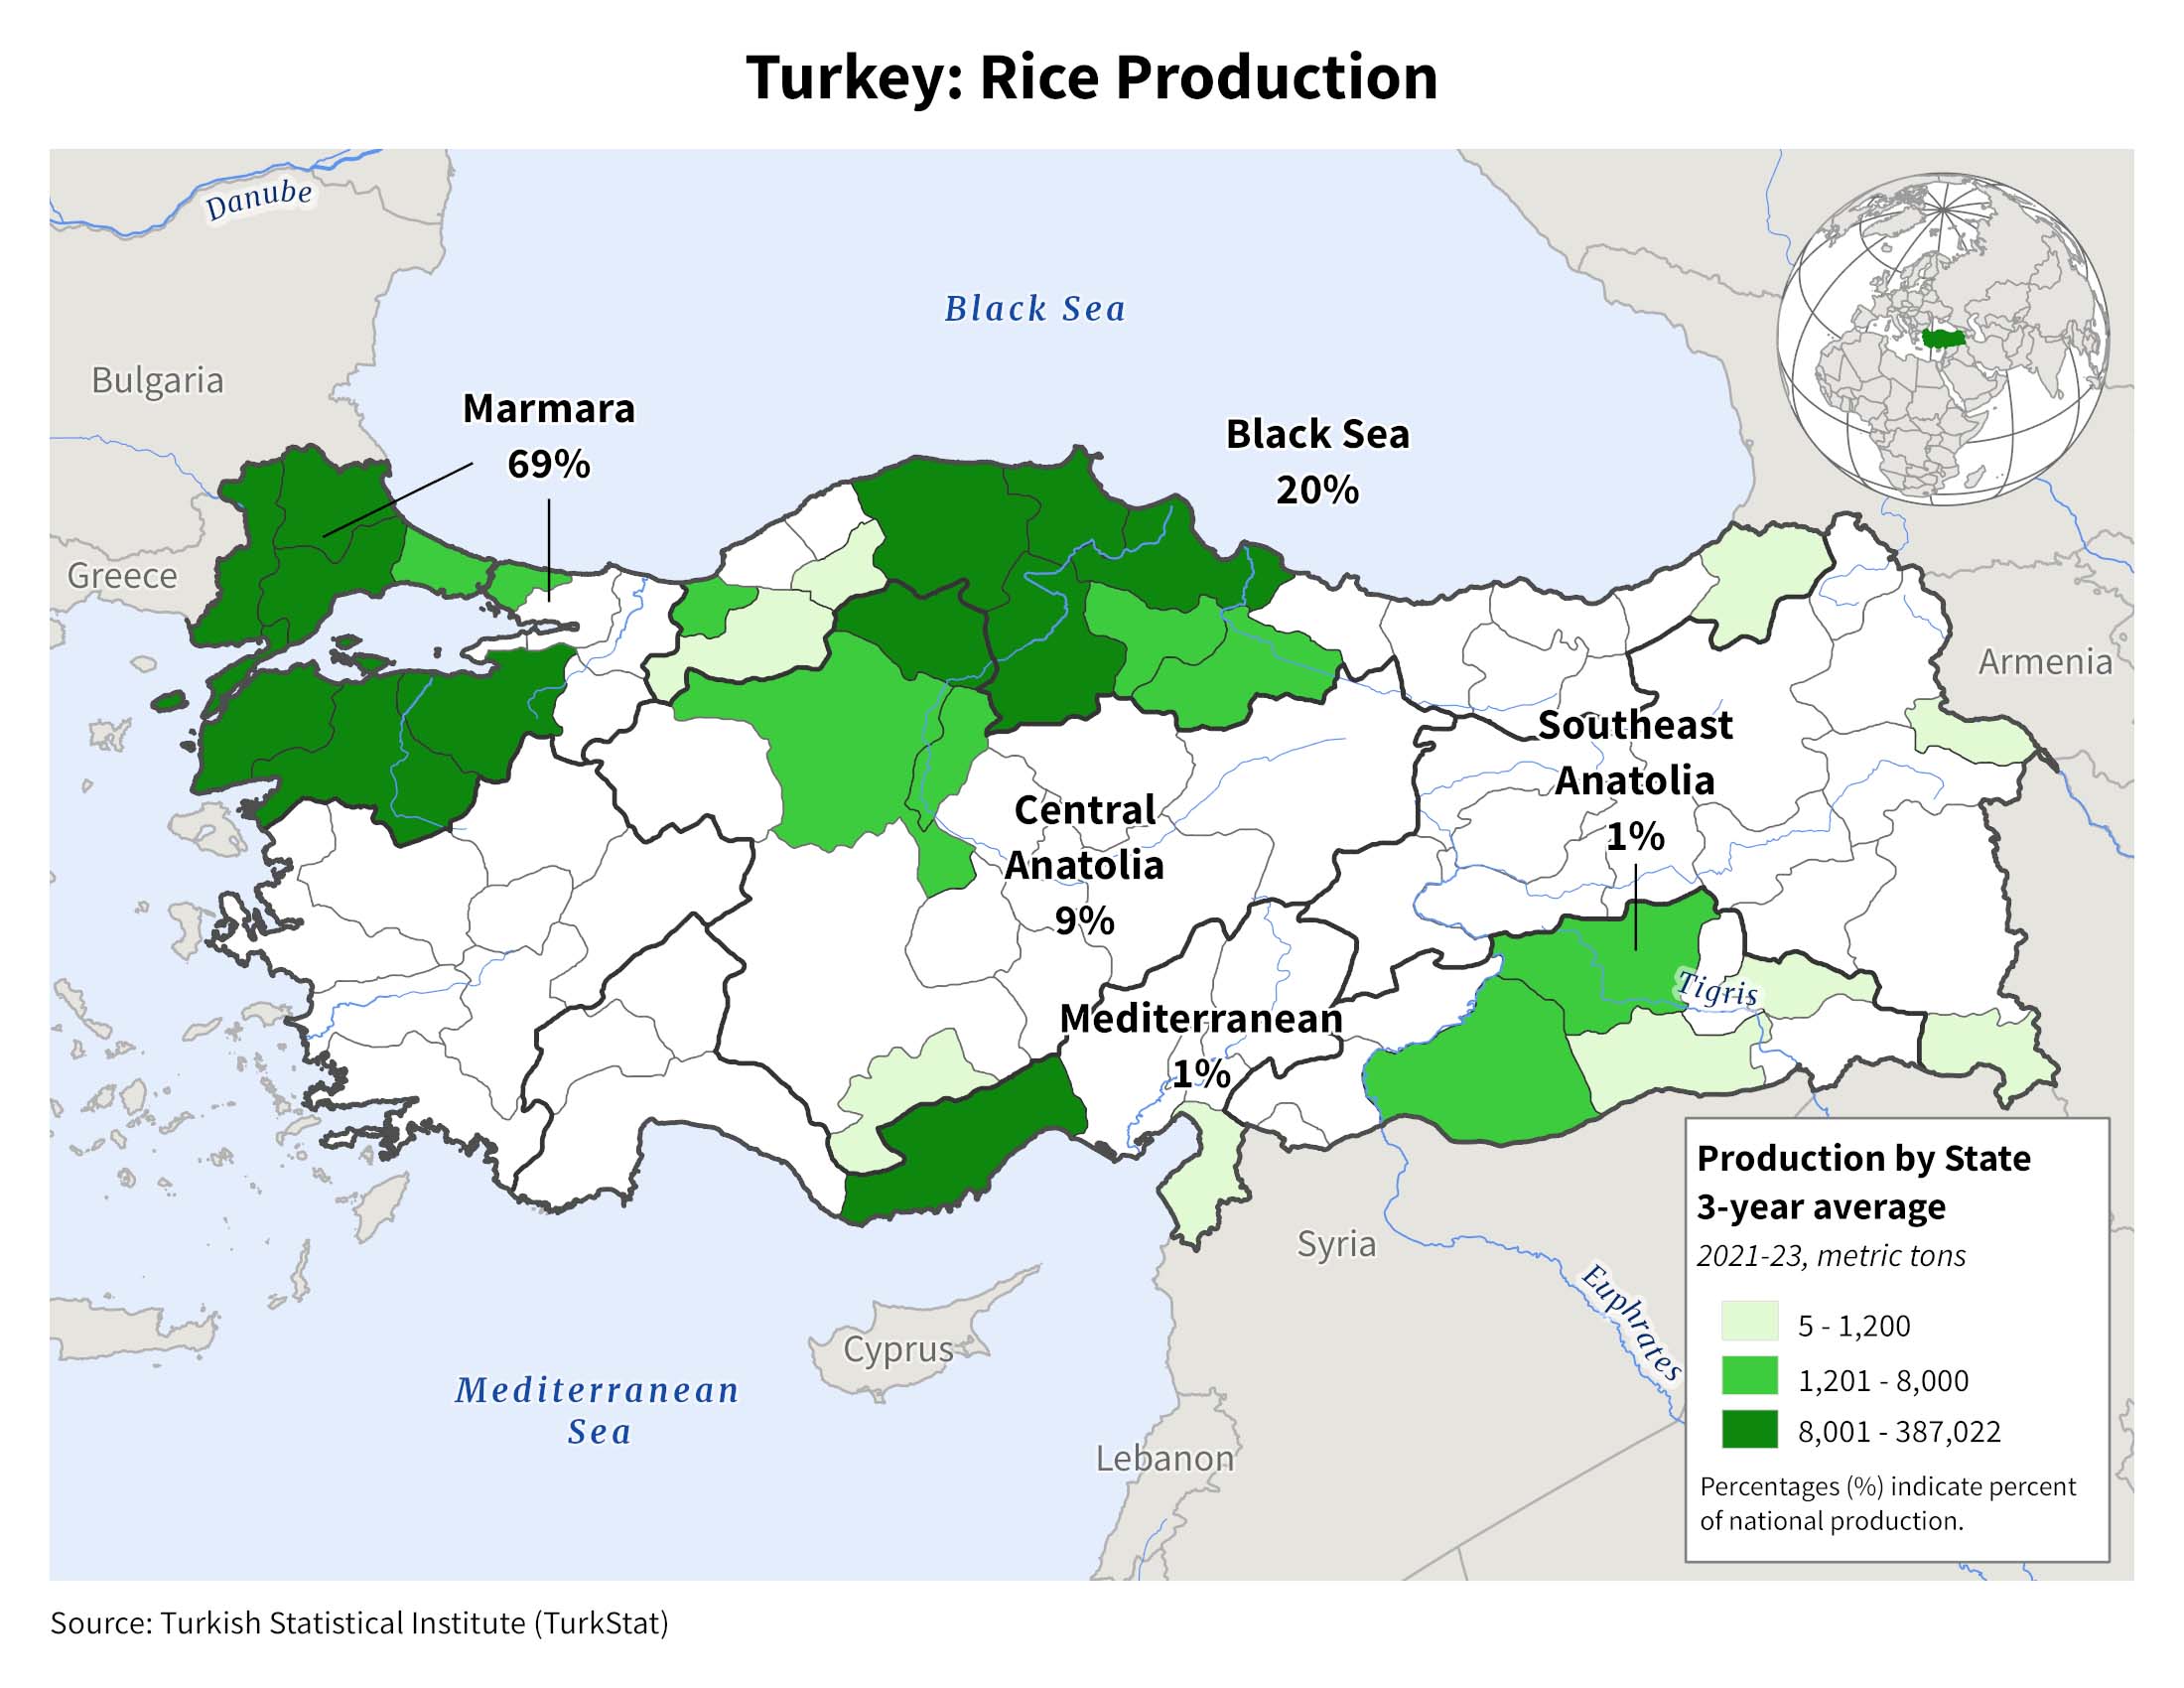
Image:

Image:

Image:

Image:

Image:

Image:

Image:

Image:

Image:

Image:

Image:

Crop Calendars
Image:

Image:

